Inbox Placement Rate vs Delivery Rate: Why They Differ

The short answer
Delivery rate is the share of messages the receiving server accepted, and it counts mail sent to the spam folder as delivered. Inbox placement rate is the narrower share that actually reached the primary inbox. So a 99% delivery rate can hide a campaign nobody sees, because "accepted" does not mean "in the inbox."
Inbox placement rate vs delivery rate difference, explained: delivery = the server accepted your mail (spam included); placement = it reached the inbox.
On this page
- 01The verdict up front
- 02Inbox placement rate vs delivery rate at a glance
- 03Where the two numbers split
- 04What "delivered" actually means
- 05What inbox placement rate actually means
- 06Why a 99% delivery rate can hide a dead campaign
- 07Where delivery rate is the better metric
- 08Where inbox placement rate is the better metric
- 09How you measure each — and what it costs
- 10Who each metric is genuinely for
- 11A third number that often matters more than either
- 12Where AI Emaily fits — and where it honestly doesn't
The difference between inbox placement rate and delivery rate is the difference between "the receiving server took your message" and "a person can actually find it." Both get called deliverability numbers, both look like percentages, and they are not measuring the same event — which is how a sender can report a 99% delivery rate to their boss while the campaign quietly dies.
Delivery rate is the honest, boring number: did the receiving mail server accept the message or reject it? Inbox placement rate is the number everyone actually cares about: of the mail that was accepted, how much landed where a human might read it, rather than in the spam folder. A message can be "delivered" and still be sitting in spam, unseen, because acceptance and inbox placement are two separate decisions made at two different moments.
This guide sets the two side by side, shows why one of them is easy to measure and the other one nobody can hand you cleanly, and explains which number you should actually watch. Where a figure can go stale — a provider threshold, an enforcement date — it is dated and pointed at the source, because deliverability rules changed materially in 2025 and most articles have not caught up. And we will be straight about our own footing: AI Emaily is an email client, not a deliverability-testing service, so this is not a page that ends by claiming our tool measures inbox placement. It doesn't, and we say where it does fit near the end.
The verdict up front#
If you remember one thing: delivery rate counts messages a receiver accepted, and inbox placement rate counts messages a human could plausibly see. Accepted mail includes everything the server filed in the spam folder, so delivery rate can stay near 100% while inbox placement collapses.
Delivery rate is measurable and trustworthy for what it measures. It comes straight from your own sending logs, in real time, at no cost, and it is the right first place to look when mail bounces or gets blocked outright. When it drops, something concrete and fixable is usually wrong.
Inbox placement rate is the number tied to results — opens, replies, revenue — but no mailbox provider hands it to you. Gmail, Outlook and the rest do not publish a per-sender inbox placement rate. You can only estimate it, from a sample, using seed lists or panel data. So the honest posture is simple: trust your delivery rate as a fact, treat your inbox placement rate as an estimate, and watch recipient engagement as the tie-breaker when the two disagree.
Inbox placement rate vs delivery rate at a glance#
Here are the two metrics on the dimensions that separate them. Read the table as two different questions about the same message, answered at two different points in its journey — not as a better-versus-worse scoreboard.
| Dimension | Delivery rate | Inbox placement rate |
|---|---|---|
| What it counts | Messages the receiving server accepted | Messages that reached the inbox itself |
| Includes spam-foldered mail? | Yes — accepted is accepted | No — spam and junk are excluded |
| What "success" means | Not bounced or blocked | A human could plausibly see it |
| Who reports it | Your ESP or send logs, directly | No provider reports it; you estimate it |
| How you get it | Free, from your own logs | Seed-list or panel tests (a sample) |
| Typical denominator | Accepted ÷ sent | Inbox ÷ delivered (varies by tool) |
| Blind to | Whether anyone saw the mail | Real recipients outside the test panel |
| Best first use | Diagnosing bounces, blocks, auth | Judging whether mail is being seen |
Where the two numbers split#
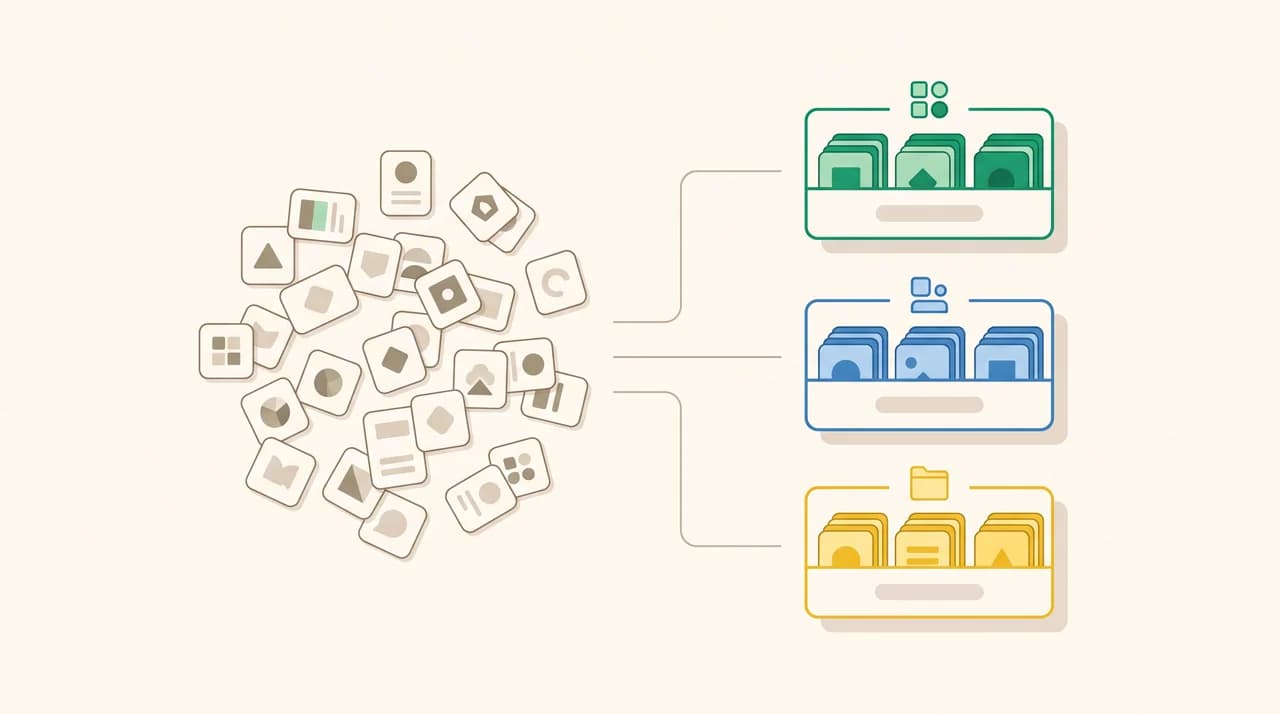
The split happens at the receiving server, in two steps. First it decides whether to accept the message at all — that decision is your delivery rate. Then, for everything it accepted, it decides inbox or spam — that second decision is your inbox placement rate.
Two gates, two numbers, and only the first one shows up cleanly in your logs. The second gate is made inside the provider's system, where your sending software cannot watch, which is the root of every difference that follows.
What "delivered" actually means#
In email, "delivered" has a precise and slightly disappointing meaning: the receiving mail server answered your sending server with an acceptance — an SMTP 250 response — instead of a rejection. That is it. The message crossed the boundary into the receiver's system and was not bounced.
Delivery rate is that outcome as a percentage: the share of messages you sent that were accepted rather than bounced or blocked. A hard bounce (the address does not exist) and an outright block (the server refused the message) both count against it. A message dumped straight into the spam folder does not count against it — because from the server's point of view, it accepted the mail. It simply chose where to file it afterward.
This is the single fact that trips people up. "Delivered" answers "did the server take it?", not "did anyone see it?". An accepted-then-spam-foldered message is, by every standard delivery metric, a delivered message.
Accepted is not the same as seen
What inbox placement rate actually means#
Inbox placement rate narrows the question to the part that matters: of the mail that was accepted, how much reached the inbox itself — usually the primary inbox — instead of the spam or junk folder. It is a subset of delivered mail, never larger than it, and often much smaller.
There is a denominator catch worth knowing. Most tools express inbox placement as a share of delivered (accepted) mail, so inbox placement, spam placement and a "missing" bucket add up to the delivered total. But some tools quote it against everything you sent, which produces a different, lower number for the same campaign. Neither is wrong; they are answering slightly different questions, so always check how your tool counts before you compare two figures.
The harder truth is that this number is not directly observable. The receiving provider knows where it filed your mail; you don't. That gap between what the provider knows and what you can see is exactly why the two metrics behave so differently in practice.
Why a 99% delivery rate can hide a dead campaign#
Picture a newsletter to 10,000 subscribers. The send logs come back looking great: 9,900 accepted, 100 bounced — a 99% delivery rate, the kind of number that shines in a report.
Now add the part the delivery rate cannot see. Of those 9,900 accepted messages, suppose a large share were filed in spam because the sending reputation slipped or too many recipients stopped engaging. Opens crater, replies stop, and the revenue the campaign used to make evaporates — while the delivery rate sits proudly at 99%.
Nothing about the delivery number is false. It is just answering a question you did not need answered. "Were the messages accepted?" — yes. "Did anyone see them?" — that is inbox placement, and it is the question the falling engagement was really about all along.
Where delivery rate is the better metric#
Delivery rate earns its keep precisely because it is a fact, not an estimate. When it drops, something concrete and fixable is usually wrong, and the number points you at it fast.
- It is measured directly. Your ESP or mail server records every acceptance and rejection, so the figure is a count, not a sample.
- It catches the hard failures first. Bounces, blocks and authentication rejections all show up as a lower delivery rate — the problems that stop mail cold.
- It is free and real-time. No test panel, no subscription, no waiting — the data is already in your logs.
- It reads the bounce reason. A delivery failure usually arrives with a code that names the cause: a bad address, a failed SPF, DKIM or DMARC check, a rate limit.
So delivery rate is the right first diagnostic. If it is low, fix that before you worry about placement — mail that was never accepted cannot land anywhere. It is the plumbing check: is water reaching the building at all?
Where inbox placement rate is the better metric#
Inbox placement wins the moment your goal is results rather than acceptance. Being accepted is table stakes; being seen is the actual job, and only inbox placement measures it.
- It tracks what drives revenue. Opens, replies and conversions depend on landing in the inbox, not merely being accepted.
- It explains the engagement mystery. A high delivery rate with falling opens almost always means a placement problem — mail going to spam.
- It reflects reputation, not just plumbing. Placement responds to your sending reputation and recipient behaviour, which is what providers actually weigh.
- It is an early warning. Placement usually slips before delivery does, so a placement estimate can flag trouble while your delivery rate still looks fine.
Watch the gap, not just the two numbers
How you measure each — and what it costs#
The two metrics differ as much in how you get them as in what they mean, and this is where budgets come in. Prices and plan shapes change often, so verify the current details on each vendor's own page before you rely on them.
Delivery rate costs nothing. It is a byproduct of sending — your ESP, SMTP relay or mail server already logs every acceptance and bounce, and the delivery rate falls out of that record with no extra tooling.
Inbox placement rate has no free, direct source, because no provider exposes it. To estimate it you use one of two approaches, both of which sample rather than measure your real audience:
- Seed-list tests: you send your campaign to a panel of test mailboxes you control across Gmail, Outlook, Yahoo and others, then check where each copy landed. It measures those seed accounts, not your actual recipients.
- Panel data: some services infer placement from a network of real users who share where mail lands. Broader than a seed list, but still a sample, and still an estimate.
What the providers give you free — and what they don't
Seed-list and panel tools are typically sold as a subscription or a usage-metered service — check the vendor's current pricing page rather than trusting a figure from an article. And keep the limitation in view: even a paid placement report is a sampled estimate of where your mail lands, not a census of your real inbox outcomes. It is excellent for spotting trends and sudden drops, and it should never be quoted with the false precision of a directly measured number.
Who each metric is genuinely for#
Different senders should watch different numbers, because they are trying to catch different failures. The table maps the common cases.
| If you are… | Watch first | Because |
|---|---|---|
| Troubleshooting bounces or a block | Delivery rate | It names the acceptance failure and its reason code |
| Running marketing or newsletters | Inbox placement rate | Revenue depends on being seen, not just accepted |
| Setting up a new sending domain | Delivery rate, then placement | Fix authentication and bounces before chasing the inbox |
| Sending one-to-one business mail | Engagement (replies) | Low volume makes placement tests noisy; replies are the real signal |
| Reporting to a boss or client | Both, clearly labelled | Quoting delivery as if it were placement is how reports mislead |
A third number that often matters more than either#
Here is the honest third option: for many senders, the metric that actually answers "is this working?" is neither delivery nor placement — it is engagement. Real opens, and especially replies, tell you a human received the message and acted, which is the thing both other metrics are only proxies for.
Engagement also feeds back into placement. Mailbox providers weigh how recipients treat your mail — do they open it, reply, mark it not-spam, or delete it unread — and that behaviour shapes where future mail lands. So watching replies is not just measuring results; it is watching the input that moves your placement in the first place.
And engagement is one number you can measure directly for one-to-one mail, where seed-list placement tests are too noisy to trust. For a sales rep or a founder sending a few dozen genuine emails a day, reply rate beats any placement estimate, because the sample is the actual conversation, not a panel of test inboxes. Use delivery rate to catch hard failures, inbox placement to catch spam-foldering at volume, and engagement to judge whether the mail did its job.
Where AI Emaily fits — and where it honestly doesn't#
A word on where we sit, because this is our site and it should be plain. AI Emaily is an AI email client, not a deliverability-testing service. It does not measure your delivery rate, it does not run seed-list placement tests, and it will not tell you what fraction of your sending reached other people's inboxes. If that is what you need, a seed-list or panel testing tool is the right instrument, and we would rather point you there than pretend otherwise. We build AI Emaily.
Where it does fit is the other side of the same line. Delivery and placement are about the mail you send; AI Emaily works on the mail you receive. On the receiving end, its spam protection and cold-email filter are the mechanism that decides inbox placement for inbound mail — routing unsolicited outreach and junk out of your inbox based on sender behaviour and domain, so that what reaches you is the mail that matters. It runs across Gmail, Outlook and any IMAP account, with a 7-day free trial on our paid plans — not a permanent free tier, and not a deliverability tool.
Frequently asked
See it in AI Emaily
Keep reading

Written by
Nafiul HasanNafiul Hasan is an entrepreneur and AI automation system builder with 10+ years of experience turning messy, manual workflows into reliable automated systems. He designs and ships AI enterprise solutions end-to-end — the agent logic, the data plumbing, and the product people actually use — and founded AI Emaily to give busy professionals their attention back. He writes here from the builder's seat: what works, what breaks, and how to put AI to work without giving up control.